In this article, we will learn the top metrics to track for your e-commerce store using Shopify Analytics.
I will also show you how to track these on your Shopify dashboard itself.

While Google Analytics remains the go-to option for in-depth Analytics on your eCommerce store performance, there’s a lot of data you can find on the Shopify dashboard itself to help you make key performance decisions about your e-commerce store.
Where is Shopify Analytics?
If you’re new to Shopify, read this guide first where I’ve explained the first steps you need to take on your Shopify eCommerce store.
You can find Shopify Analytics on the left menu of your Shopify dashboard.
We will start by heading to the Reports sub-menu inside the Analytics menu as shown in the screenshot below.

Once you’re in the reports, you will see different categories like Sales, Acquisition, Customers, and Marketing reports among others.
We’re going to explore the most important reports you need to review.
Shopify Analytics: Sales Over Time (Business Report)
This is where you can see a snapshot of your revenue for each day, week, month, quarter, or year.
I’ll show you an example of a Q1 2020 report in the reference below.
To generate this report for your store, just select the date range and enter the quarter you’d like to see the report for, and in the group by option, select ‘month’.

This is a great place to do a Quarter-wise or month-wise or any custom date-wise sales reporting.
If you know your usual margins, you can also get a fair idea of your profit by exporting this report to a Google Sheet or Excel and working the numbers fairly quickly.
Shopify Analytics: Sales By Discount (Marketing Report)
Most stories run sales and marketing campaigns using discount codes. If you’re one of them, this report will be really helpful for you.
The Sales By Discount report helps measure the performance of your marketing campaigns.
This report will also help you understand the number of discounts given so you can see how profitable they were.

Of course, this only shows the conversions if a discount code was used.
For other campaigns where you don’t use a discount code, I suggest creating UTM links and tracking conversions from those links.
Shopify Analytics: Sales By Product (Product Report)
Moving to Inventory Performance within the same category of Sales Reports, you will find the Sales by Product report.
This report is excellent to understand which of your products are selling more than others.
You’ll also be able to identify outliers which I define as:
Any product that sold more organically than a promoted product without marketing efforts in a given time period.
These are the products I make the focus of my next marketing campaigns.
P.S. I don’t use the Acquisition reports provided by Shopify. I still like to rely on Google Analytics for this category.
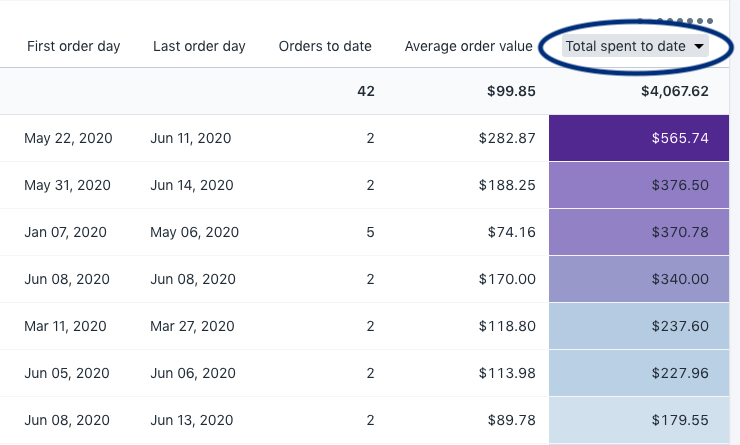
Shopify Analytics: Returning customers (Retention Report)
One of the best reports for new stores that they must be looking at during their initial months of operation is the ‘Returning Customers’ report.
Once you are an established store, you’d probably move to the ‘Loyal Customers’ report.
However, during the initial months, returning customers should get your attention – in terms of free gifts, campaigns, or even a personal call or note of thanks.
These can also be converted to referrals who will get others to your brand.
I usually like to sort this report by ‘Total Spent till Date’ as shown in the screenshot below.
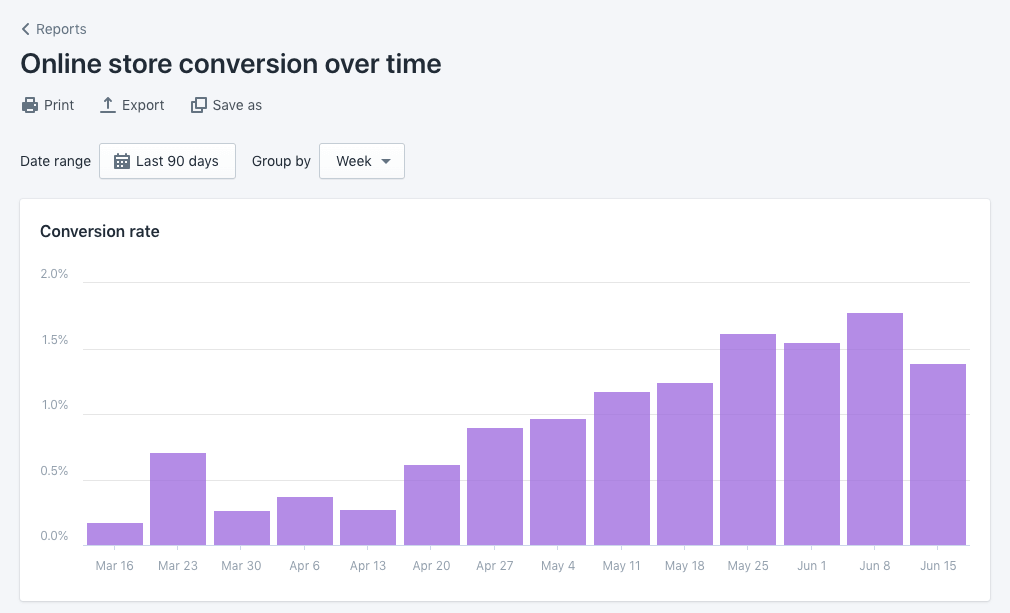
Shopify Analytics: Online store conversion over time (Conversions Report)
Your store’s conversion rate is the percentage of visitors on your website who make a purchase.
The conversion rate is the answer to the question: For every 100 people that land on my website, how many of them make a purchase?
This is a key metric for everyone – marketing, tech, store optimization, and business.
I’ve explained the Conversion Rate metrics in detail in this article.
As you will learn in the article above, the conversion rate is a percentage measure.
You can easily track the conversion rate using the ‘Online store conversion over time’ report under the ‘Behavior’ report on Shopify Analytics.
I like to select the ‘group by’ option on this report based on how many times I’ve made changes or ‘experiments’ to optimize the Conversion Rate of the store.
You can see the following screenshot for a sample report:
Conclusion
These are some of the most important reports you should be tracking. That being said, every store is different and your business goals and marketing process should dictate which reports you should be measuring more.
For example, if you’re running experiments to improve your Average Order Value once your Conversion Rate is already stable, you may not need to track the Conversion Rate each week and focus on the ‘Average Order Value Over Time’ report more frequently.
The most important thing is to find the right data so you can make decisions and progress in your business.
All the best!