
If you’re an app marketer or founder, you should know your way around Google Play Console so you can get the most important data points you need to make decisions at your fingertips.
In this post, we’ll focus on the ‘STATISTICS’ tab within Google Play Console Statistics includes various reporting options and views.
Let’s look at the 5 most important reports you can analyze inside the statistics section for your Android app listing:
Total Number of Installs
Though this is often vanity, it’s a good place to start this article as many entrepreneurs and marketers ask me this question – especially after Google made this a sort of ‘hidden’ metric.
And to be honest, I won’t recommend checking this metric way too often. However, it does serve as a milestone check for many. If you’re a marketer hired with the main goal of increasing app installs, then you should be looking here.
And if you’re an entrepreneur if it keeps you motivated, surely go for it!
- Step 1: Head to Statistics > Select Users from the report down > Select User Acquisition > New users

- Step 2: From the metric calculation dropdown, select Cumulative.
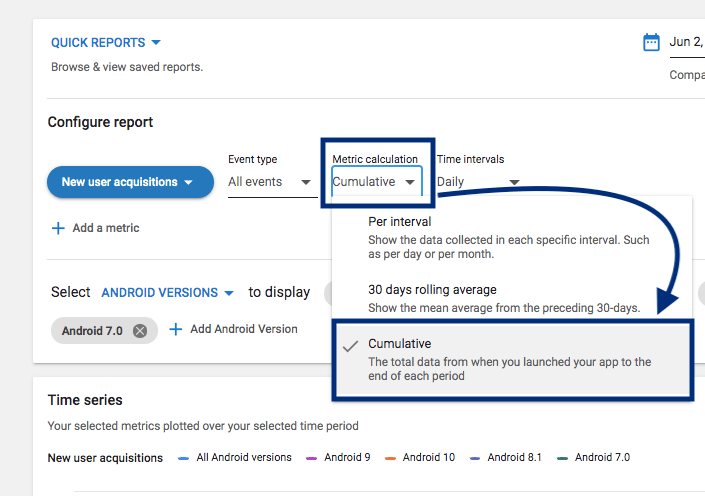
This should show you the total number of installs on the graph report generated below as you point to the number shows for today’s date.
It’ll be a cumulative total of app installs on your Android App Listing.
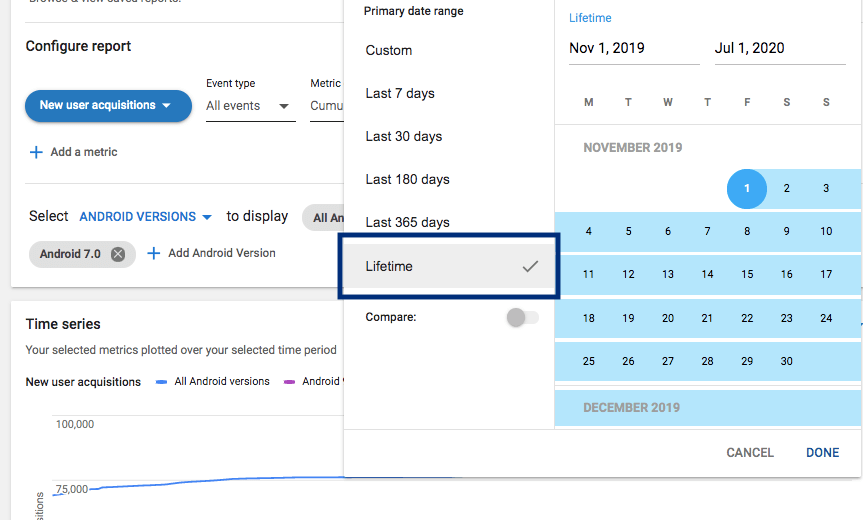
Further, you may configure this report for ‘Lifetime’ to see the overall cumulative trendline of app installs.
That being said, there are many better metrics to track and just the number of app installs is rather shallow.
Active Devices Report
‘Active Devices’ might be a confusing term initially. But let’s clarify what it means first before we get into the report.
An Active Device is basically just a device that was active or ‘turned on’ in the past 30 days. That’s Google’s definition of an active device. Note that is about the device itself.
Even though initially this seems like a good metric to know how many active devices your app is installed on, note that it’s just a little better than report 1.
The best measure of your app activity would still come from your app behavior reports that you could find in Firebase or similar tools – or even basic metrics using Facebook Analytics if you have your SDK integrated with your Facebook Ad Campaigns.
Within Google Play Console, I find the Active Devices metric slightly better than just the total number of app installs.
You can get a date-wise view of this metric as shown below.
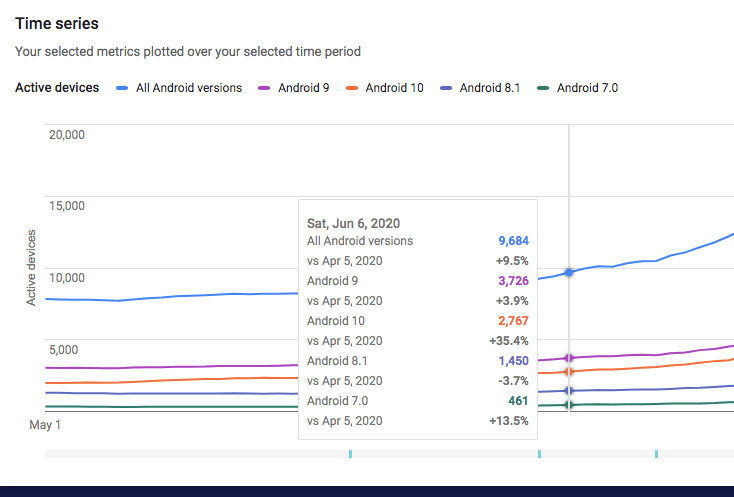
Again, don’t forget to change the timeline using the top-right calendar drop down to choose the dates you want to check this for.
As you can see, the numbers by individual Android version also help developers deep dive into seeing what new releases are working and needed.
Ratings Report
Within Ratings, I recommend you first look at the ‘Cumulative Average Rating’ report.
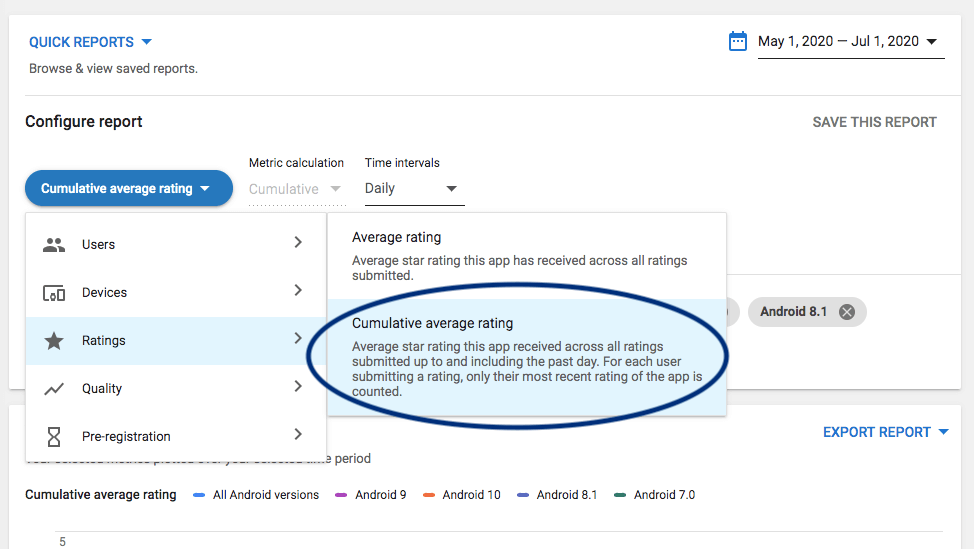
This will give you an overall idea of how ratings are accumulated and what your usual rating is over time.
You can then switch to the average rating report and see if the recent averages are way below expectations before and after an event – for example, a new app release, or even a new growth marketing campaign.
Uninstall Events (vs Install Events)
Believe it or not, this is my favorite report on Google Play Console Statistics.
As a marketer or entrepreneur, we often just celebrate the success of our app install campaigns.
What’s more important in the bigger picture is if people really find the install useful or not.
Or even worse, if they absolutely hate it and uninstall it.
You can find this report under the Devices dropdown as shown below.

Further, you can also compare this to another metric like Install events as shown below.

Growth Rate Compared to Peers
As marketers, we love to see how we stack up against the competition.
This may be useful or maybe completely useless depending on your industry and goals, I’ve often found focusing on just making your app better than before and marketing it better than before is usually sufficient.
However, if you’d still like to, just pick any metric from the reporting and scroll down below the reported graph.
That’s where you’ll find the growth compared to peers in that industry for any of the selected metrics.
So this is more like a common analysis across reports and not a reported metric in itself.
In the screenshot below, you can see the growth rate compared to peers for the metric ‘Install Events’.

This will change when your metric selection changes as discussed in the previous reports.
Lastly, you can export any of the reports you learned in this post using the top-right dropdown icon on any of the charts.
Remember, even though I don’t rely too much on Google Play Console as an app marketer, sometimes, you need to work with what you have.
And if you’re looking at your Console options, these reports will give you a fair overview of what’s happening around your app and your listing.
That being said, do not limit yourself to Google Play Console for reports as a marketer and entrepreneur.
I wish you all the best with your app marketing campaigns.

