… while improving ROAS from 214% to 239%
Google Ads Account Overview
We started working with this account in mid-October 2023.
This is what the account looked like by the end of October.

October 2023 results
3 months later, we had scaled this account to more than $114,000 in revenue per month while…
- Increasing ROAS from 214% to 239%
- Lowering CPA from $31.24 to $28.15
We also reduced the number of conversions from branded search terms from 49% to 31%.

April 2024 results
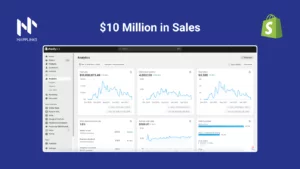
In this google ads case study, we’ll walk you through this account’s journey from $14,347/month to $114,188/mo.

Total account results from October to April, 2024
Google Ads Account Audit: What Are We Working With?
When we start working with any new e-commerce account, we begin by auditing the account to understand what we’re working with.
Here’s what we’re usually looking at in this initial audit.
- Conversion tracking
- Audiences
- Product feed
- Product performance
- Account structure
Then, based on the results, we’ll plan the next steps for the account.
- Building the account’s foundations.
- Optimizing existing and new campaigns.
- Scaling the account.
Conversion Tracking
Conversion tracking needs to be done right.
These are some of the questions we can ask to ensure everything works properly with our google ads.
- Are conversions triggering when they’re supposed to?
- Are enhanced conversions being recorded?
- Are the main conversions properly set to ‘Primary’?
After a brief analysis, we uncovered a few issues.
- There were two ‘Purchase’ tags installed. In other words, some conversions were duplicated.
- None of the conversion tags had enhanced conversions enabled.
Basically, this happened because these tags were installed via Google Tag Manager using two different accounts.
Considering that this website was built on Shopify, we:
- Migrated conversion tracking to Shopify’s native integration.
- Were able to easily enable enhanced conversions.
Audiences
One of the most common mistakes business owners make is that they underestimate the power of audiences in Google Ads.
Mostly, because they assume their only use is for remarketing.
But that’s not true.
And so, one of the first things we did was to connect Klaviyo to the Google Ads account and sync an audience to auto-populate every day with all our customers.
- These can be used in Performance Max campaigns as audience signals.
- These can be used to provide signals for campaigns using smart bidding strategies to optimize performance.
The next thing was to make sure the Google Tag was properly installed and ensure we were able to run dynamic remarketing ads.
In summary, we needed to make sure our Google Tag was capturing dynamic event parameters to power our dynamic remarketing campaigns.
Once we migrated our tags to Shopify instead of Google Tag Manager, we started capturing these parameters clearly.
Product Feed
The product feed is arguably the most important thing you want to get right if you’re running e-commerce campaigns on Google Ads.
Since Shopping and Performance Max campaigns rely heavily on the feed’s data for multiple purposes, optimizing the feed is essential in order to get the best possible results.
As we audited the account, we uncovered multiple issues.
- This brand had a significant amount of product feed issues including:
- Disapproved products
- Repeated products
- Products without reviews
- And more
- The product titles were under optimized and had no structure at all. The brand simply included the product’s name but left out important attributes such as size, material, or even the brand name.
- The brand was using no custom labels to organize its feed.
- Lastly, even though some of the brand’s top sellers were on sale, these promotions weren’t reflected in the feed.
These were all things we were able to fix quickly to turn the account’s performance around. In less than a week, we:
- Fixed all disapproved products.
- Created 3 different custom labels.*
- Optimized product titles by following a simple structure: [product name] – [size] + [material] + [custom label 1] + [brand name]
- Added the ‘sale_price’ attribute to the feed in order to show the ‘sale’ tag in our product ads.
*we’ll cover the different custom labels in the next chapter “product performance”.
With these simple changes, we were sure we could improve performance for our Standard Shopping and Performance Max campaigns.
Product Performance
From years of experience working with Google Ads, we’ve realized that for most brands, 80% of the sales often come from 20% of the products.
So the next step in our audit was to uncover which products usually sold the most and if our budget was properly allocated to these products.
Here’s what we found.
- There was one product category that was responsible for almost 50% of the sales. It also only accounted for about 20% of the Google Ads account’s spend.
- One specific product collection was responsible for 30% of the sales at a very profitable rate.
- Everything else was pretty even.
So to fix this, we knew we had to:
- Aggressively push more budget to the top-selling product category.
- Create different custom labels:
- Custom label 1: product collections
- Collection 1
- Collection 2
- …
- Custom label 2: selling rates
- Top seller
- Mid seller
- Low seller
- Custom label 3: price ranges
- Under $30
- Between $30-$60
- Between $60-$90
- Above $90
- Custom label 1: product collections
With these custom labels, we could now easily see performance for the different collections, selling rates, and price ranges, and allocate budget accordingly.
Account Structure
Once we had a well-structured feed and had taken care of the basic account settings, it was time to actually start working on the account.
So we started laying the foundations for our first campaigns – what we call the core campaigns in any e-commerce account.
These 3 simple google ads campaigns will ensure we’re targeting all three different stages of our buyer funnel: cold traffic, warm traffic, and hot traffic.
- A standard shopping campaign targeting all products in our feed, except our top-selling category.
- A Performance Max campaign targeting the top-selling product category exclusively (using the custom labels we created earlier)
- A search campaign targeting branded keywords.
Standard Shopping
Even though more than 60% of today’s campaigns on Google are Performance Max, we still believe Standard Shopping plays an important role in e-commerce accounts.
- They’re better at new customer acquisition.
- They provide more data when it comes to search terms.
- They don’t focus as much on remarketing.
- They can work well alongside Performance Max.
So the first step was launching a shopping campaign targeting all different products, breaking down each category into its ad group.
For new accounts, we tend to launch this campaign alone to collect some data and find our top-performers before moving them to a new Performance Max campaign.
However, in this case, we already knew what our top-performing category was so we were able to immediately move it into its own Performance Max campaign.
Performance Max: Top-Sellers
As mentioned earlier, there was one particular product category that accounted for 50% of this brand’s total sales.

However, only around 15% to 20% of the budget in the account was allocated to these products.
This was a huge mistake.
So we launched a Performance Max campaign targeting this product category exclusively. This would allow us to:
- Increase conversion rates by focusing on proven winners.
- Lower cost per conversion.
- Increase ROAS.
- Target users across the entire funnel stage.
We believe this simple change was one of the big factors for this account’s improvement in performance.
Search: Branded Keywords
This client operates in a very competitive niche.
There are at least 7 competitors selling very similar products and, most often, it turns into a race to the bottom where each competitor will try running bigger promotions to capture new customers.
So more than capitalizing on existing brand search terms, we wanted to protect our brand keywords.
So we launched a simple search campaign to do exactly that.
Optimizing Google Ads Campaigns: Step-By-Step
Launching the campaigns was just the first step. Then, we needed to optimize them.
There were 5 main areas we focused on:
- Improving bids
- Adding negative keywords
- Excluding poor-performing products
- Optimizing assets (copy, images, etc)
- Optimizing asset groups (Performance Max)
Bid Strategies for E-Commerce
Since this account already had some data, it was easy to start improving our bidding strategy.
Basically, we want to make sure each campaign has enough data for Google’s algorithm to work as well as possible.
Once we have at least close to 25-50 conversions in the last 30 days in the same campaign, we’ll try moving it to target ROAS. In this case, we knew from previous data that our best-selling category converted at around 300% ROAS. So we:
- Set a target ROAS at around 250% to make sure our campaign wasn’t restricted by bids.
- Gradually increased bids over the coming weeks until we got to around 320% target ROAS.
We applied the same logic for all other campaigns.
Adding Negative Keywords
The solution to effective keyword exclusion is shared negative keyword lists.
Here are some of the lists we created:
- Brand
- Always Exclude
- Competitors
- Careers
- Adult
- Deals
- DSA
- Education
- Websites
- Travel & Real Estate
- Other
Some of these keywords you can add without even looking at the search terms report because you’ll never want to rank for search terms that include these keywords. For example, “free”, “hiring”, “quiz”, “cartoons”, and so on.
Excluding Poor Performing Products
Once the campaigns have gathered enough data, the next step is to figure out which products are profitable and which ones aren’t.
This is easy to do either by:
- Accessing the ‘Listing Groups’ tab in each Performance Max campaign.
- Accessing the ‘Product Groups’ tab in Standard Shopping campaigns.

These two products are significantly under-performing compared to other products so it might make sense to exclude them
Typically, we’ll look for products that have spent at least 3x-5x our target CPA. If they didn’t perform above our targets, we’ll exclude them.
Optimizing Performance Max Assets
Even though this is a more automated campaign type, it doesn’t mean we shouldn’t be updating assets and improving the campaign in any way we can.
One of these ways is to rotate assets such as images, headlines, or descriptions that aren’t performing well. Even though Performance Max doesn’t share a lot of data, we can still see which assets have the best performance (according to Google).

So we’ll remove anything that’s labelled as ‘poor’ and add new assets consistently over time.
Optimizing Asset Groups
Last but not least, we’ll focus on optimizing existing asset groups.
We did this this in multiple different ways.
- Test feed-only vs full-build asset groups.
- Create different asset groups for audience segments that are performing well.
- Create different asset groups for different sub-categories (search terms).
- Add new videos and images.
Feed-Only vs Full-Build
One of the first tests we ran to improve performance was to test feed-only asset groups against full-build asset groups.
In short, we removed all assets from the full build asset group except the product feed. Images, videos, and copy were all removed.

In one of our first tests, feed-only asset groups significantly outperformed full-build asset groups.
Different asset groups for good-performing audience segments
Another simple way to improve performance is to find an audience segment that’s performing well and creating a dedicated asset group (with relevant images, copy, videos) for that particular audience.
It’s an easy way to improve performance.

In this particular case, we could see that ‘Interior Design & Decorating Services’ was converting relatively well and was a unique audience for our product. So we created new assets to target these users.
Add New Images & Videos
Based on the results above, we could easily spot a few trends and different audiences that we could easily build some new assets for and target these users almost exclusively.
And that’s exactly what we did.
As you can see in the image below, this led to a big increase in results.

Scaling the Account: Going From $14,000 to $114,000
Then, the last step was to scale the account.
There were several steps we took in order to scale the account.
- Scale horizontally by entering new markets.
- Scale horizontally by adding new campaigns.
- Non-branded search.
- DSA
- New Performance Max campaigns targeting other product categories.
- Scale vertically by increasing spend gradually.
Scale Horizontally: New Markets
The campaigns we had initially launched were targeting the US exclusively.
A simple way to scale would be to replicate our most successful campaigns into new markets such as Canada and the United Kingdom.
We started with branded campaigns and slowly expanded to Performance Max campaigns.
Scale Horizontally: New Campaigns
We launched two new campaigns to target keywords higher up in the funnel and expand our search term coverage.
- Dynamic search ads (DSA): this would target all of our product collections and focus on keywords we might’ve otherwise missed.
- Non-brand exact match keywords: focusing exclusively on our top-performers.
- Launched new Performance Max targeting different product categories and collections that were performing well.
The latter would reach an average +300% ROAS within a few weeks and become crucial to scale the account.
Scale Vertically
Lastly, we raised the budget on our best-performing campaigns by 15%-20% every 3-4 days consistently over time.
We didn’t want to increase our budgets too quick as this would potentially hurt our performance, so we were careful while scaling.
If you have any specific questions or need further assistance, feel free to book a call with our team of e-commerce experts here.